While most decisions in the studio are, naturally, made by ear, audio meters are useful tools at every stage of production. Besides the ubiquitous level meters that dance along with the music, modern DAWs may include a number of additional metering options that can provide useful information about audio signals, both in mixing and especially in mastering, and dedicated metering utilities - like iZotope’s Insight - often offer a full suite of helpful metering tools. Here’s a brief look at some of those meters.
Level meters
Level meters, of course, are everywhere in a DAW - there’s bar-graph metering for basic signal level in every channel, including auxes and the Master Fader. And given the widespread use of compression in modern mixing, there may also be metering that shows gain reduction in each channel strip. Individual plug-ins often have their own metering, both to aid in gain-staging, like in EQs, and, again, to show level and gain reduction, as in compressors.
On the surface, level meters are pretty straightforward - they show current signal levels and warn of potential overloads. But there are different types of meters, with different ballistics, and they can provide more information than just simple level. In DAWs, most meters are the familiar bar-graph type, and those are typically peak meters, which show levels based on maximum signal peaks. But many meters also include an additional level indicator, that shows a version of the signal’s average level (often an RMS reading). This readout is similar to the display of older, slower VU meters, which track only average levels, too slow to display the faster transient peaks.
Average vs peak
The difference between the average levels and peaks levels in a signal is very useful information. Considering how much compression is often employed in modern mixes, and the aggressive use of compression and especially brickwall limiting to raise the overall average level of a mix at the mastering stage, a dual average/peak meter readout can inform the engineer of just how much effect this is having on the dynamic range of the compressed/limited signal. Our ears gets used to the sound of compressed audio, and it’s easy to lose track of just how much punch and impact is being sacrificed, but a glance at the peak-to-average level difference can remind us not to go too far in that regard.
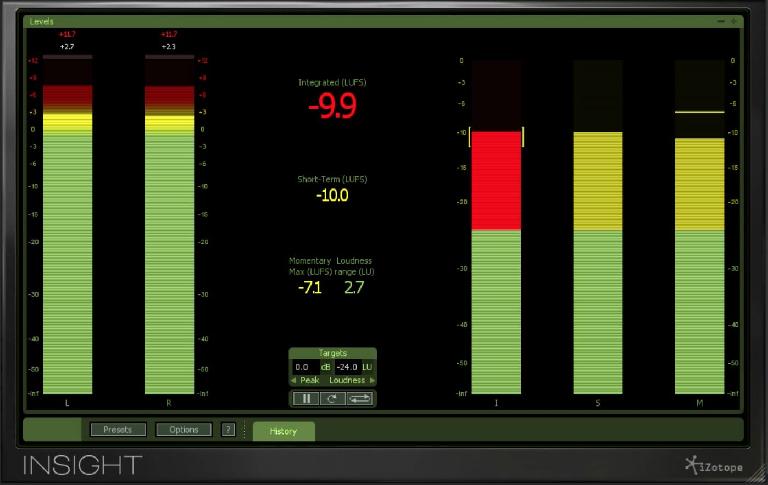
In an acoustic audio signal, the peak-to-average difference can typically be 15-20 dB, but modern compression and limiting practices often reduce that to as little as 8 or 9 dB - some of the worst offenders may take it down to as little as 6 dB difference (!), for a very loud average signal level, but one with little transient impact, lacking in punch. If the combined average-peak readout in a meter shows a very small peak-average difference, this can serve as a warning that the music may be sacrificing too much of its dynamic range for the sake of overall loudness, and that information might suggest that the engineer back off on the compression and limiting. This can be the case at any stage of production, but it’s especially true in mastering.
New standards
In addition to traditional Gain and dBfs scales, some modern meters may incorporate readouts that include newer measurement scales, like LUFS - Loudness Units Full Scale - which was developed for broadcast applications, as part of a group of mandated standards for limiting overall Loudness (average level) to more consistent, and more reasonable, levels.
Though not yet mandated for music distribution, the trend toward lowering average levels has begun to drift over to the music side of the industry, with many streaming services enforcing lower average levels. What this means is that, even if you limit transients in a effort to increase overall volume, your tracks will be pulled down so their average levels don’t exceed a reasonable maximum, making the dubious Loudness War practice of extreme brickwall limiting pointless - a welcome trend.
In the broadcast world, maximum average levels are restricted to -23 or -24 LUFS (dBfs), leaving plenty of headroom for some nice, punchy transient peaks. On the music side, recommended average levels are a bit higher, at around -12 dBfs, and -14dBfs seems to be emerging as a new standard (see the recent article on Spotify’s adoption of that standard). Those same broadcast standards also include a peak level component - True Peak readings. When levels approach digital maximum, even a hard limit of slightly less than 0dBfs (-0.3dBfs is common in mastering) may, for technical reasons, still allow the signal to exceed 0dBfs after D->A conversion. True Peak metering factors this in, usually requiring a maximum peak level of around -1 or -2 dBfs.
Some meters that display both peak and average level (LUFS) - like Logic’s updated Loudness Meter plug-in - may also let you set a target average level, making it easier to see at a glance how close you are to your desired peak-to-average level difference, and helping avoid overly-squashed tracks, mixes, and masters.
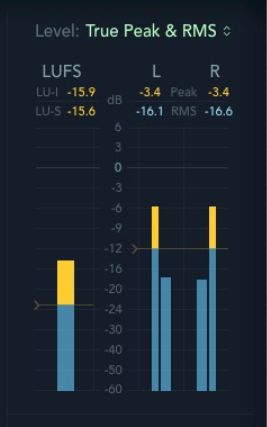
Logic’s updated Loudness Meter
Stereo stuff
Of course, level readouts are not the only kind of useful information meters can convey. Some meters provide useful information about the stereo image. A Balance meter indicates whether the overall stereo image in well-centered or is tilting toward left or right. This can happen for a variety of reasons, both technical (improperly balanced monitors) and procedural (unbalanced panning) - a Balance meter that deviates too far from the center position can warn of this, allowing for appropriate adjustments to be made, either in the mix (re-thinking panning choices) or in mastering (overall balance tweak).
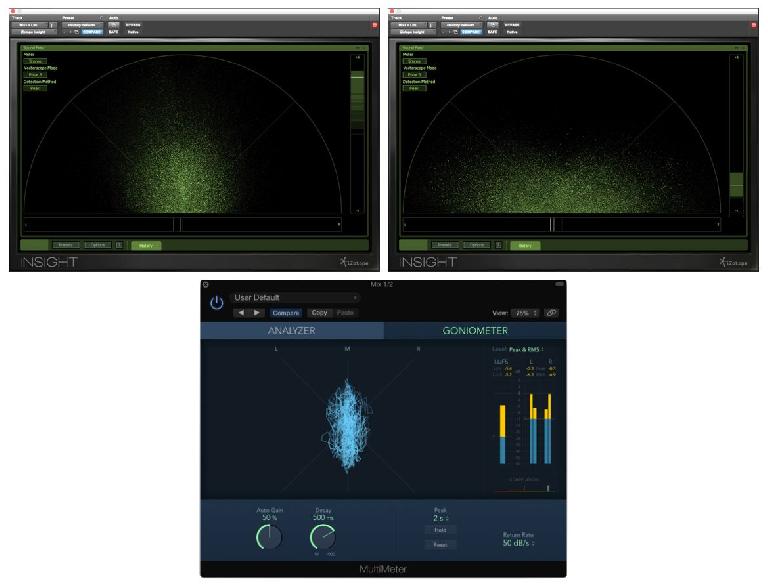
The relative phase between left and right channels in a stereo signal can also be displayed, with a Vectorscope or Goniometer, and/or a Correlation meter. Again, too much phase difference between channels can result in imaging issues, or cancellations if the signal is heard in mono. In a vectorscope, the display shows how much in-phase and out-of-phase information there is in the signal - if the display shows too much horizontal data, this can be an indication of potential phase problems. Different display options may be available, and there’s often an associated phase Correlation meter. In a Correlation meter, normal readings for good stereo would fall between 0 (center) and +1; for stereo audio with potential phase issues, readings would be between 0 and -1. These displays can provide a heads-up, again allowing the mixer or mastering engineer to correct for any potential issues before the audio is finalized for distribution.
The Full Spectrum
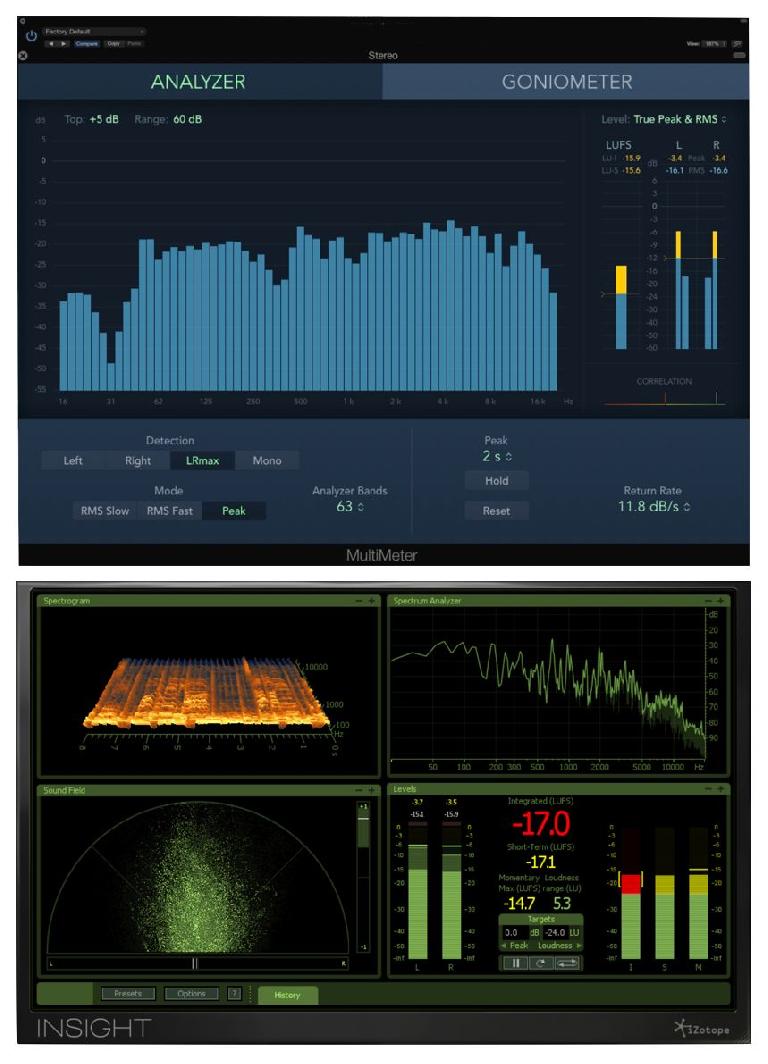
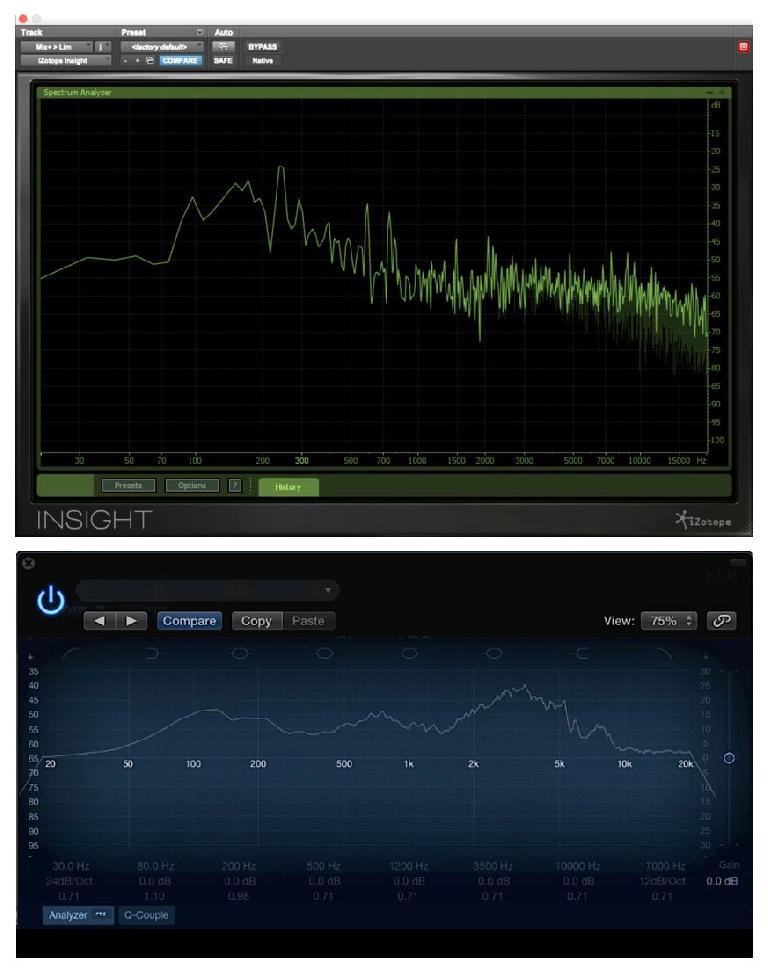
Most people are probably somewhat acquainted with a more familiar tool, the Spectrum Analyzer, which shows the relative levels of frequencies across the range of 20-20kHz. Besides dedicated metering tools, many EQs also include this display, which, of course, can provide a visual indication of both the inherent tonal (frequency) balance of the audio and any changes being made with EQ. Seeing where any problematic peaks or dips in the frequency balance are occurring makes it easier to target the appropriate frequencies with corrective EQ, and a spectrum display can also help convey a better sense of the overall tonal balance of signals. Spectrum analyzers can often be set to display the frequency balance as either a continuous curve or discrete frequency bands (typically third-octave or more).
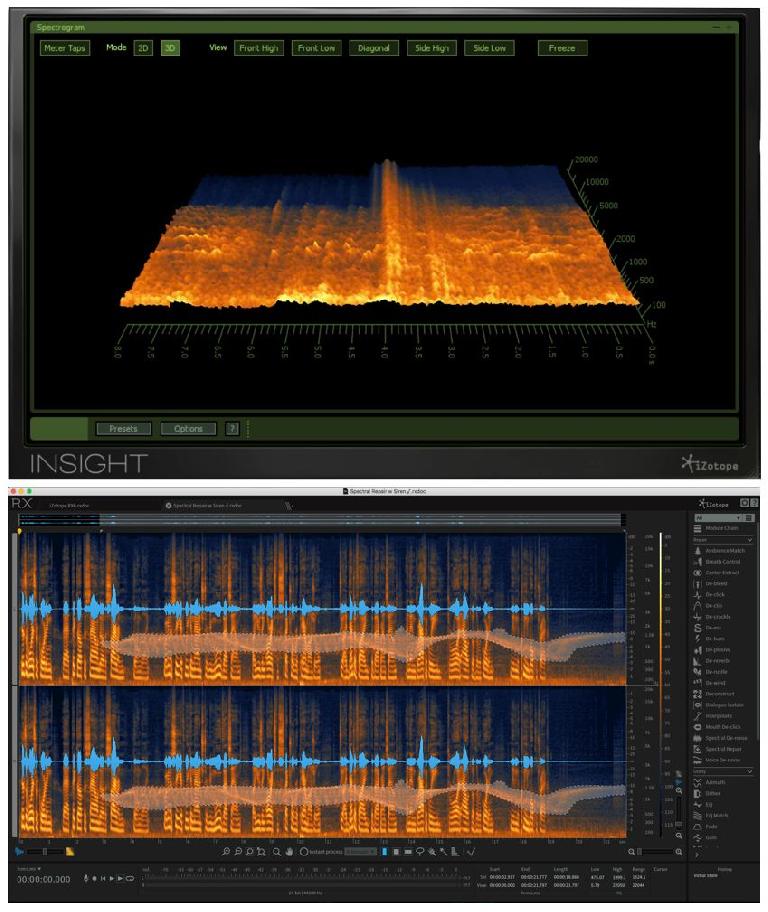
Another spectrum-related display is the Spectrogram. This can show frequency, level and time, in either a 2D or 3D view. A lot of information can be conveyed in a Spectrogram display once you get used to it. More advanced audio processing tools like iZotope’s RX6 use the Spectrogram not just for display purposes, but as an editable display, allowing the user - with a little practice - to hone in on specific elements in a complex audio wave and perform edits that previously would have been unthinkable, like removing unwanted sounds (such as leakage) embedded in an audio file.
Read the meter
All the various metering options mentioned here can be extremely helpful not only with basic tasks like setting appropriate levels and avoiding over-compression, but also in diagnosing more subtle potential problems like phase, frequency, and stereo imbalances, allowing a savvy engineer to get on top of those issues before a project leaves the studio. So if you haven’t yet explored all the metering options in your DAW, go ahead and check ‘em out - one of them might just save the day.


 © 2024 Ask.Audio
A NonLinear Educating Company
Discussion
Want to join the discussion?
Create an account or login to get started!